The 12-lead ECG below (figure 1) and additional V1 rhythm strip (figure 2) were recorded from an 80-year-old female who was admitted to hospital with increasing dyspnoea. She had had previous admissions for dyspnoea. An echo showed severe biventricular dysfunction, moderate mitral regurgitation, mild aortic stenosis, mild tricuspid regurgitation and evidence of pulmonary hypertension. See if you can provide a full description of the ECG, paying particular attention to the rhythm. The baseline artefact presents a challenge when it comes to working out the rhythm but I still think it’s possible. This is a problem that has to be contended with often in real life! Please add your thoughts below.
Dr Dave Richley
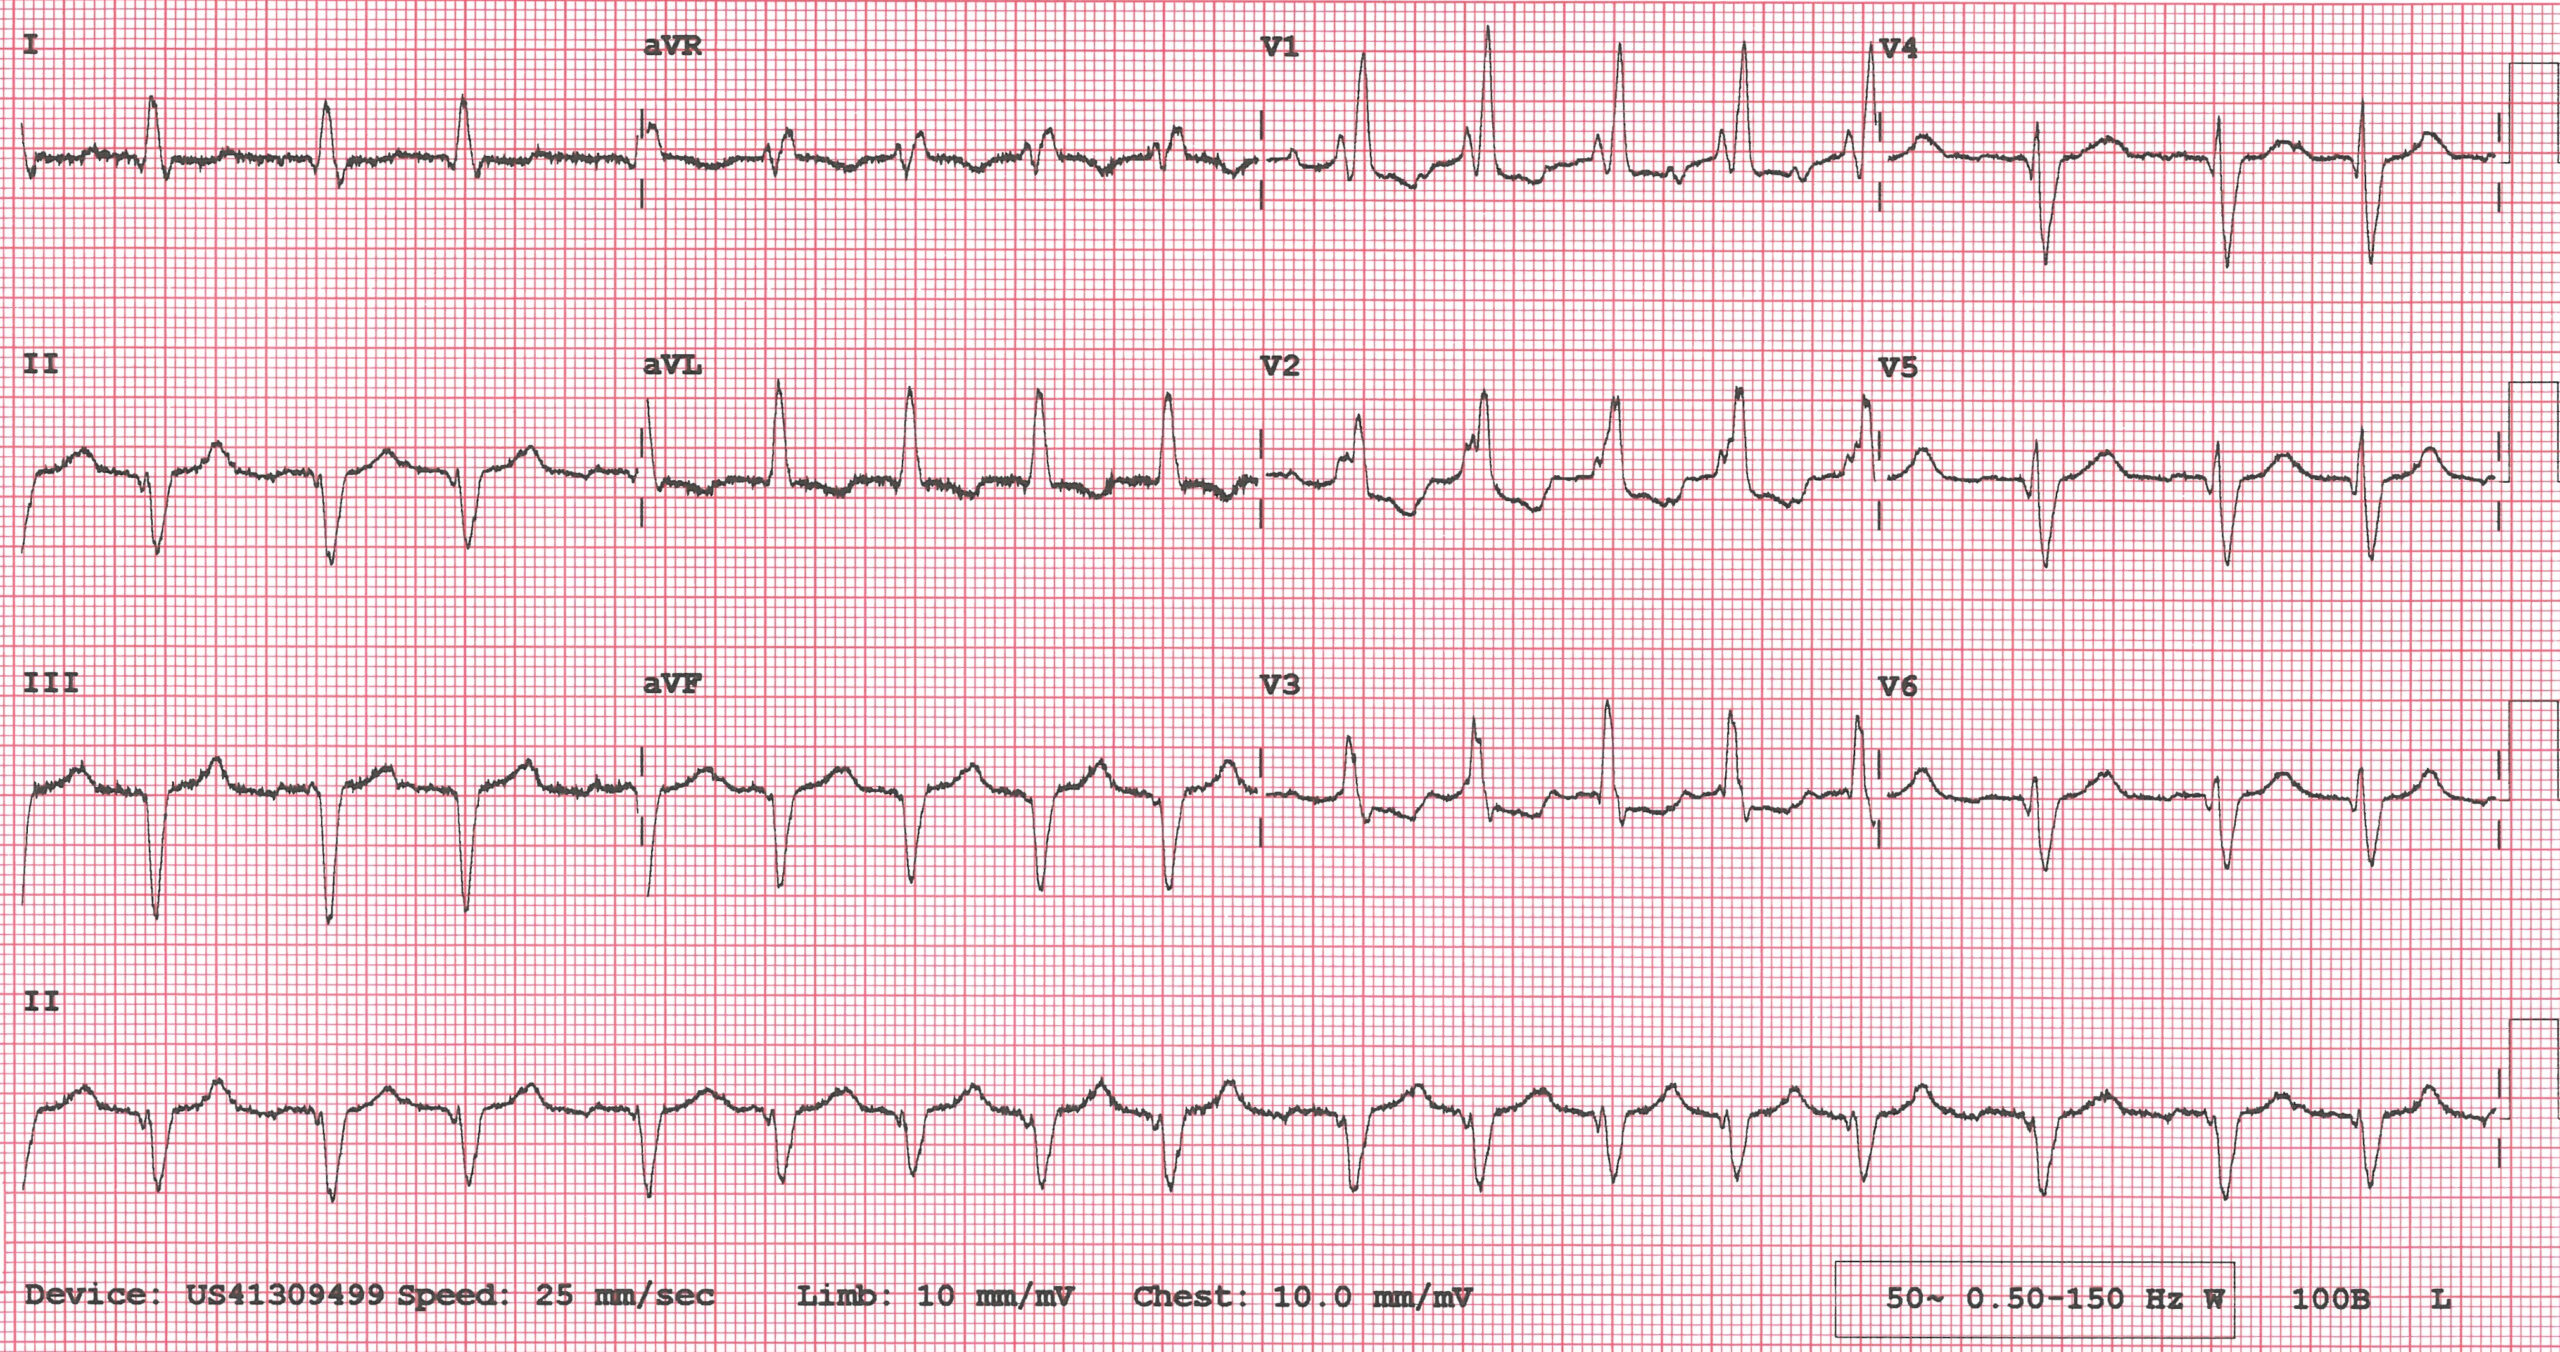
Figure 1. 12-lead ECG of an 80-year-old female with dyspnoea.
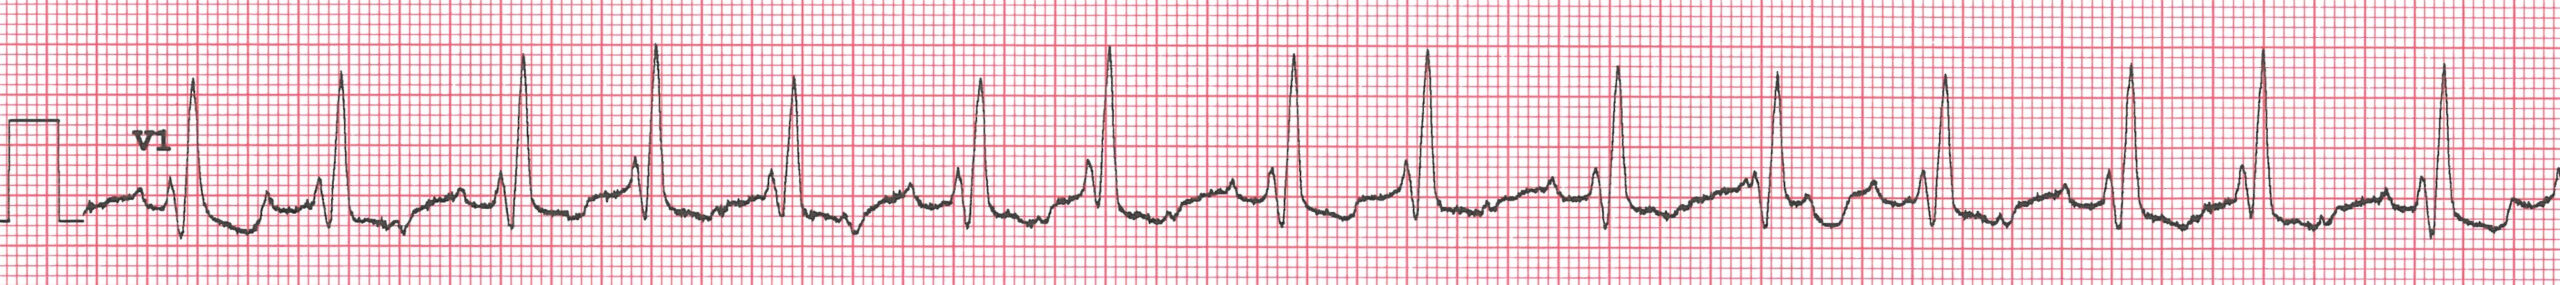
Figure 2. V1 rhythm strip
Answer Added 24.08.24
A comprehensive ECG report can be considered to comprise two main elements: a descriptive account and an interpretation. The descriptive account is an objective list of the ECG’s features and the interpretation is what it all means. The description is usually the more straightforward element and can be carried out even in the absence of any accompanying clinical information, whereas the interpretation of the descriptive findings is not so simple and is very much influenced by other factors such as the age and sex of the patient, their presenting features, drug treatment and clinical history. Interpretations can also vary: different clinicians may have different opinions on what the objective findings signify.
This ECG is quite challenging with regard to both description and interpretation, and part of the problem is the high-frequency artefact that tends to obscure small deflections within the ECG signal.
Let’s start with the rhythm. It’s difficult to discern atrial activity in the limb leads, and indeed in most of the chest leads, but if we study the V1 rhythm strip (figure 2) it is apparent that there are fast, regular identical atrial deflections. In figure 3 I have shown with arrows where I think all the atrial deflections are. Clearly visible deflections are shown with an unbroken line and deflections which I think are obscured by artefact or hidden within a QRS are shown by dotted lines. The atrial rate is about 250/minute, so the atrial rhythm must be either atrial flutter or atrial tachycardia. I can’t make out typical flutter waves in the limb leads, but this may be because of the artefact. Because of the very high atrial rate, I think that atrial flutter is perhaps more likely than atrial tachycardia.
The ventricular rate is irregular and in atrial flutter this is usually because of multi-level AV nodal Wenckebach block. I have constructed a laddergram (figure 4) that shows how the ventricular irregularity might be due to mixture of 2:1 and 3:2 Wenckebach block in the upper AV node and a mixture of 2:1 and 3:2 and longer runs of Wenckebach block in the lower AV node. These ratios though are just conjecture and may not reflect exactly what is happening – there may be other equally or more plausible combinations of upper and lower AV nodal Wenckebach block. In fact, Arron Pearce and Ōkóyè Ō – both of them ECG experts – suggested that there might be 2:1 block at the upper AV node and varying Wenckebach block below it, so I tried to construct a laddergram to represent this. The outcome is the laddergram in figure 5. This may be plausible but I find it difficult to explain the big jumps in conduction time in the lower AV node. Of course, all of this speculation about different ratios of dual-level AV nodal block is of no clinical importance – it’s just an academic exercise.
If we now look at the full 12-lead ECG (figure1) we can see that there is a left axis deviation of about -60 degrees. The most common cause of this is left anterior fascicular block (LAFB) but the pattern here is not absolutely typical of LAFB. In LAFB there is usually an initial small R wave, followed by a deep S wave in the inferior leads but the QRS in lead II in this ECG begins with a small Q wave, after which there is a small R wave, then a deep S wave. Lead aVF appears similar, but with even smaller Q and R waves – see figure 6. The artefact in lead III makes it difficult to ascertain with confidence whether there is an rS or QS complex there. My suspicion is that what we see is consistent with both left anterior fascicular block and established inferior myocardial infarction.
There is an obvious right bundle branch block (RBBB). It has been suggested that the tall second R wave in V1 and the dominant S wave in V6 suggest right ventricular hypertrophy (RVH) but I’m not sure about this. RVH is usually associated with a right rather than left axis deviation; the tall R wave in V1 may just be part of RBBB pattern; and the dominant S wave in V6 may be due to left anterior fascicular block, which usually causes an abnormal R wave progression in the chest leads. However, we do know that this patient had pulmonary hypertension, so maybe there was some RVH.
There seems to be some downsloping ST depression from V1 to V3. This can’t be attributed to the RBBB and it may be evidence of myocardial ischaemia, although ST depression is a non-specific abnormality. There are also pathological Q waves from V4 to V6. Although not huge in absolute terms, these Q waves are deep in relation to the height of the R waves that follow. The most likely explanation for these Q waves is lateral wall infarction, which is corroborated by a Q wave also in lead I. Therefore, because of the Q waves in II and aVF also, perhaps there has been an inferolateral myocardial infarction.
This, then, is quite a difficult ECG, both to describe and to interpret. When reporting an ECG such as this, where are there are genuine uncertainties, I think it’s perfectly acceptable to set out the possibilities rather than attempt a definitive simple conclusion.
To summarise, I think this ECG shows atrial flutter or tachycardia – more likely flutter – with an irregular ventricular response (mean rate approximately 100/minute), probably due to dual-level AV nodal Wenckebach block. There is right bundle branch block and a left axis deviation of -60 degrees as a result of left anterior fascicular block and/or established inferior myocardial infarction. There is ST depression from V1 to V3, suggestive but not diagnostic of myocardial ischaemia, and Q waves in leads I, II, aVF and V3-V6 suggestive of involvement of the lateral wall in the infarction. There is also an abnormal R wave progression in the chest leads, with a tall R’ wave in V1 and dominant S wave in V6, which may be explained by the conduction defects already described or may possibly indicate right ventricular hypertrophy.
I am very grateful to Su Baxter for sharing this case with me.
Dr. Dave Richley
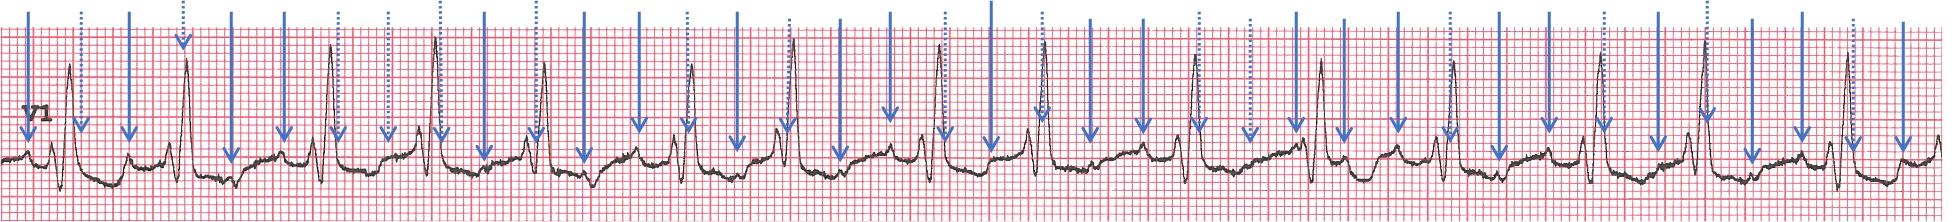
Figure 3: V1 rhythm strip with atrial deflections indicated by arrows.
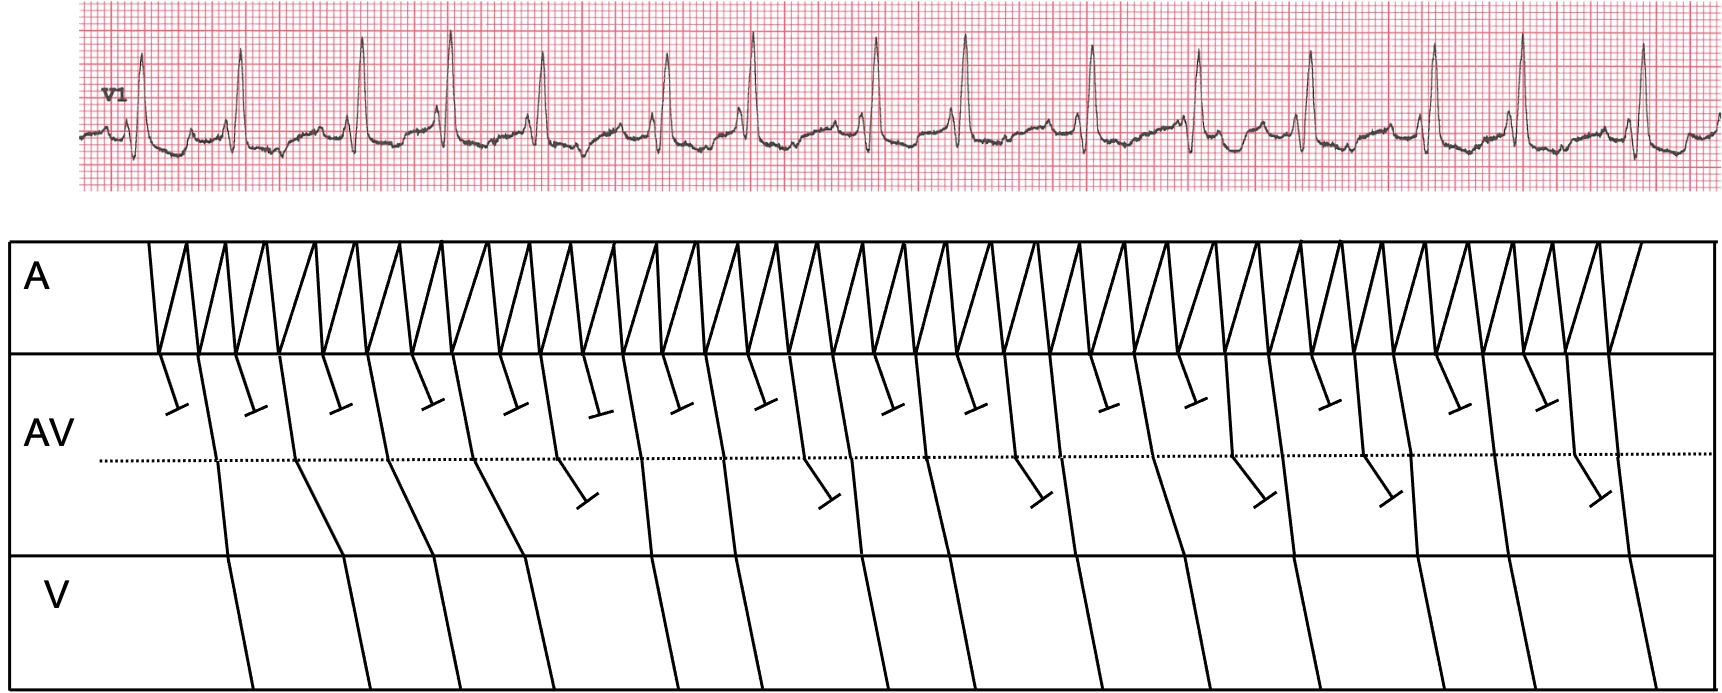
Figure 4: Laddergram postulating dual-level AV nodal block with mixed conduction ratios at each level.
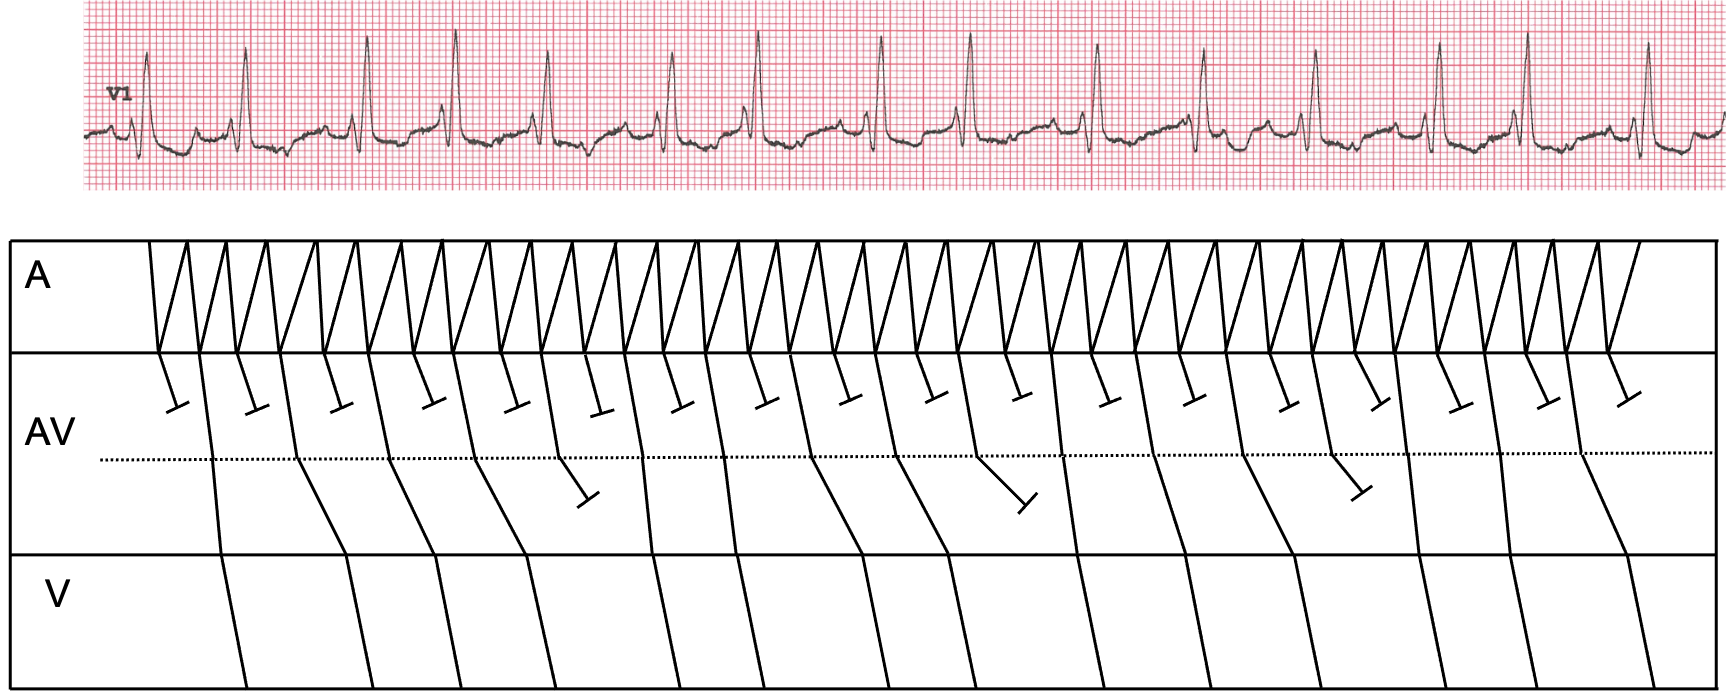
Figure 5: Alternative laddergram showing 2:1 block at upper AV node and mixed conduction ratios at lower AV node.
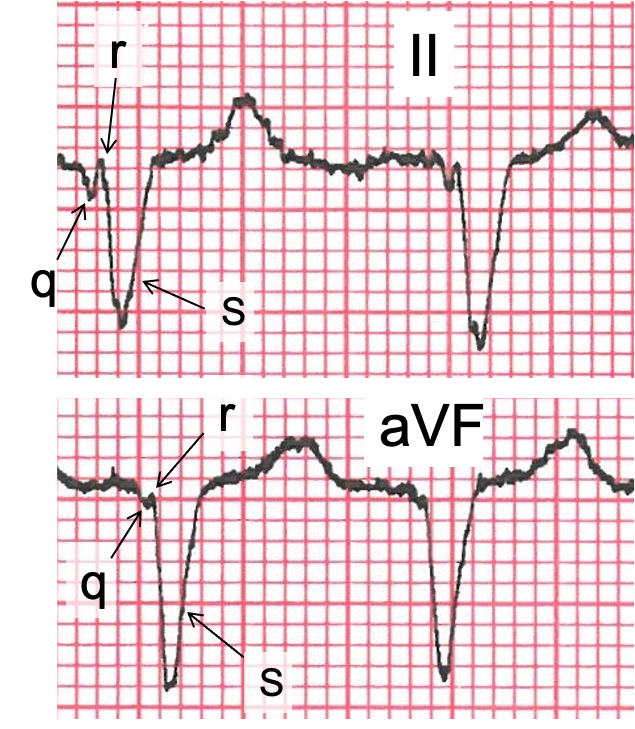
Figure 6: Magnified view of 2 complexes from leads II and aVF to show the constituent QRS deflections.
Addendum Added 28.08.24
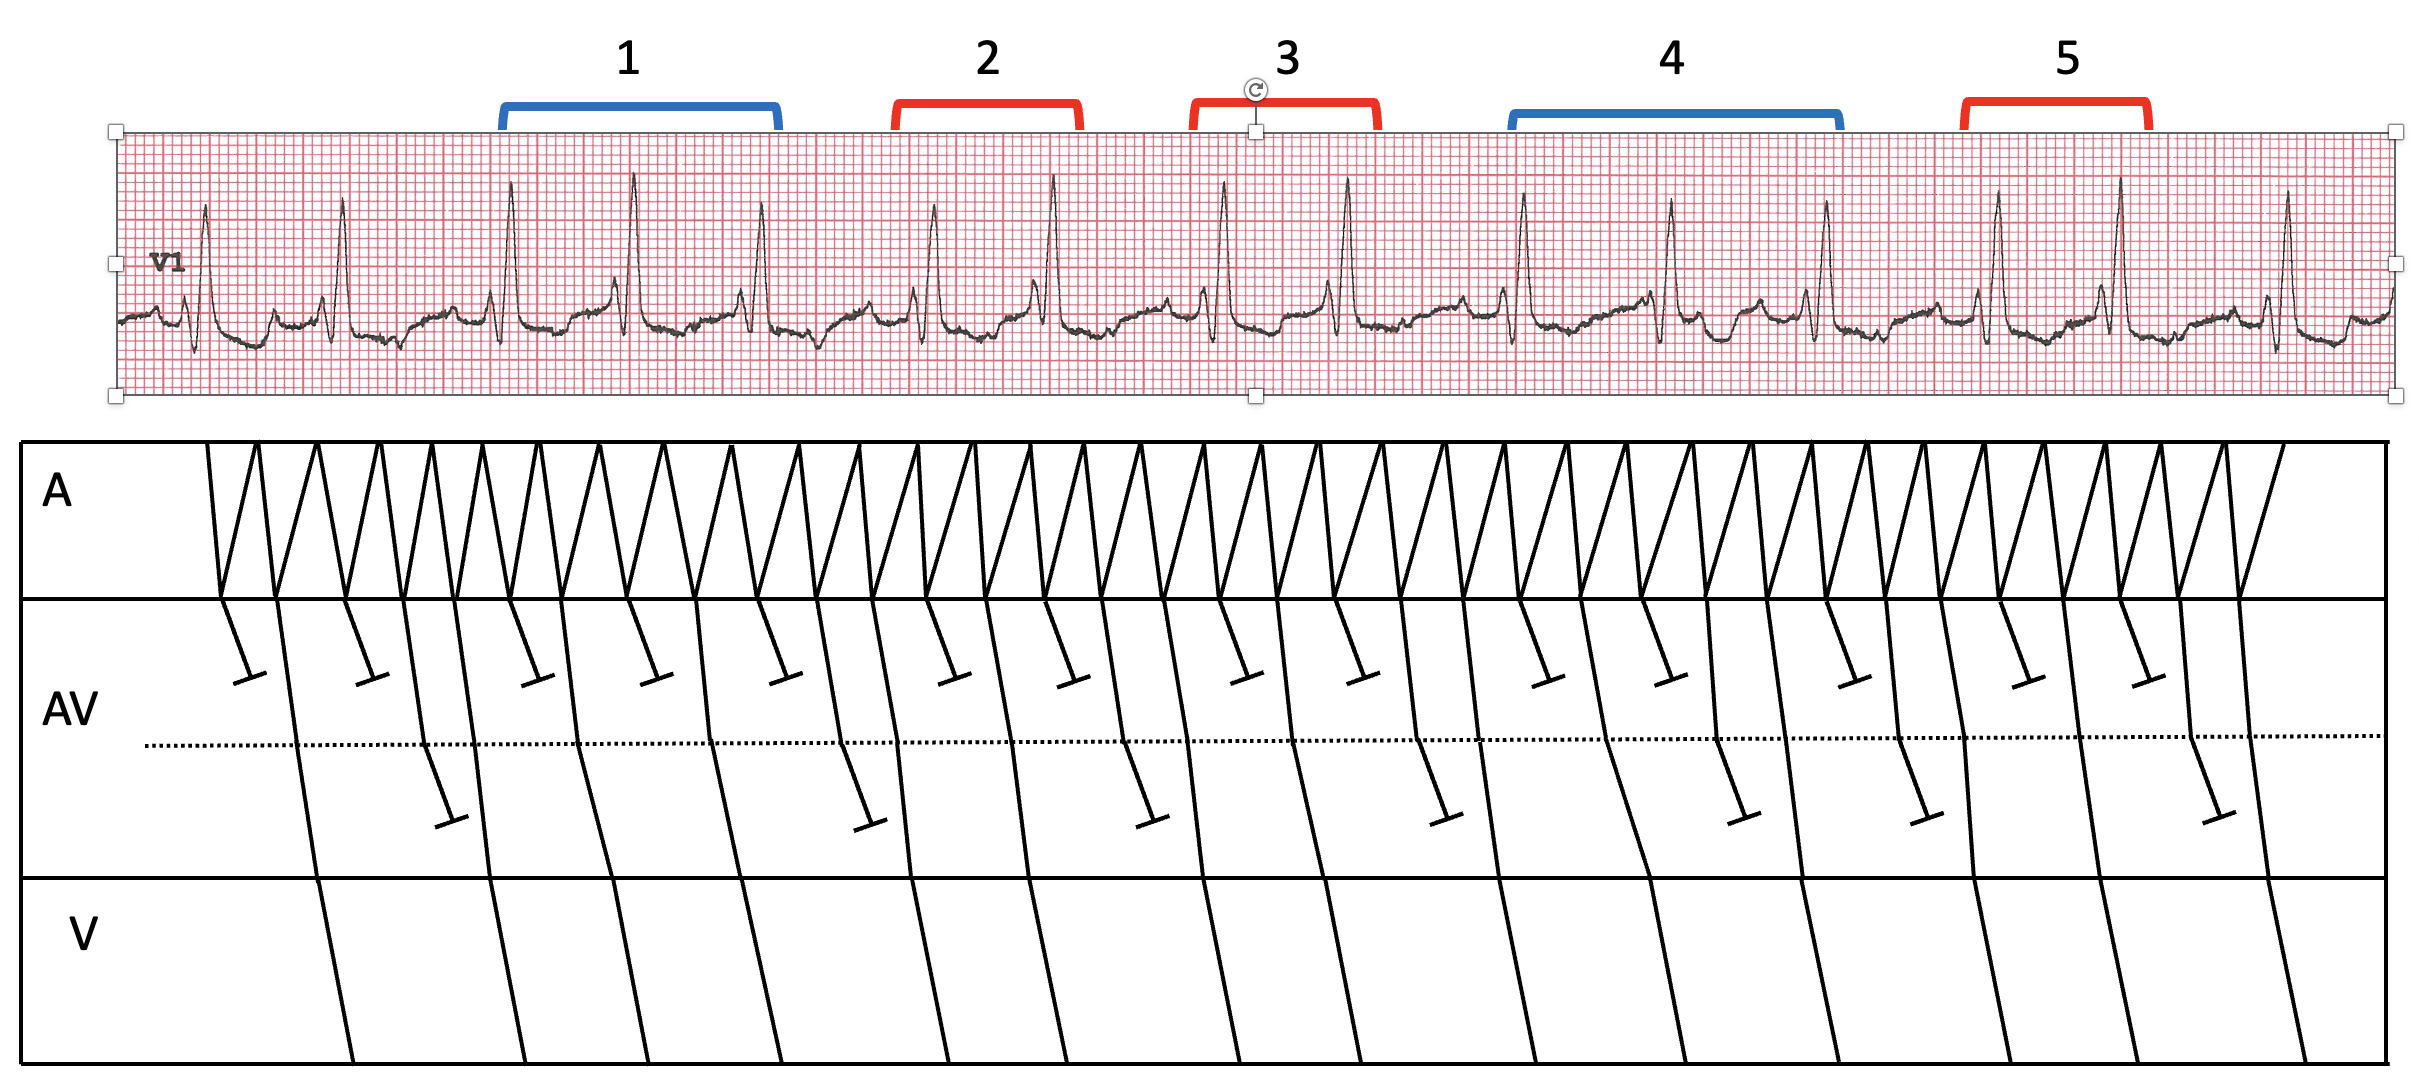
Arron Pearce has responded to my explanation of the rhythm by proposing a slight variation to the laddergram in figure 4 – see figure 7 and his explanation below. I think that this is probably entirely plausible, and I don’t think it’s possible to determine with confidence which of these various detailed depictions of the conduction pattern is most likely to be the correct one. And of course, the correct explanation could be something entirely different. I realise that this level of detail is of no clinical importance but it can be interesting to try to work these things out.
Dr. Dave Richley
‘I think Dave’s suggestion of mixed conduction ratios at both levels makes the most sense (varying cycles of 3:2/2:1 at the upper level and 4:3, 3:2, 2:1 at the lower level). Again, this is just a theory and impossible to prove. I have made some minor amendments to figure 4, as I have a slightly different opinion of conduction for the first half of the strip.
You will notice that the QRS complexes are grouped together in twos and threes – grouped beating is a typical feature of Wenckebach conduction. I have highlighted the beats in twos with red brackets and the threes with blue brackets. Looking at the beats grouped in pairs, you can see that the conduction patterns are the same with similar PR interval cycles. However, the two groups of three have slightly different conduction patterns from each other, but they still amount to three beats being grouped together. My version of the laddergram shows a slight variation of conduction ratios at the lower level. I note that Dave’s version of figure 4 shows grouped beats 1 and 4 beginning their sequences slightly differently, whereas I think they may begin with the same initial sequence.
In essence I agree with Dave, but propose a slightly different view of conduction for the first half (it makes little to no difference though!).’
The immediate features are the right bundle branch block and a degree of irregularity. Baseline artefact makes it difficult (but maybe not impossible) to comment on p-waves, but I suspect I can make out something like flutter waves.
My money would be on atrial flutter (probably atypical) or similar atrial tachycardia
Thanks, David. Are there any other features that you would mention in a full description of the ECG?
Sinus tachycardia, Wenkebach 2nd degree AVB, RBBB, LAFB. TWI aVL.
Thanks, Caleb.I agree with some of what you say, but not all of it. I won’t say anything further just yet.
Multifocal Atrial tachycardia
RBBB
LAFB
RVH Strain pattern
Thanks, Tamil. In multifocal atrial tachycardia there are normally multiple P wave morphologies and an irregular atrial rate – do we definitely see that here?
Sinus tachy, Mobitz 1 (Wenkebach) AVB, Bifascicular block (RBBB +LAFB), TWI aVL.
Atypical Flutter at about 240bpm with variable , 2:1 , 3:1 conduction, RBBB + LAFB. with NS ST/Twave wave abnormalities that are probably rate related. LAD + late transition (deep S Waves in L precordium) support LAFB, but in this case difficult to rule out concurrent RVH although the marked LAD would argue against this. The baseline artefact makes it difficult (for me) to positively RO QS pattern in the inferior leads/ INF MI of indeterminate age.
Some good detailed observations and comments there, Jeff. Thanks.
Is there any evidence of Bipolar pacing spikes which would support diagnosis of LV or CSP pacing?
As far as I know there is no pacemaker of any type, Bill. If I’m informed to the contrary I’ll let you know!
Hi Bill,
interesting thought. I admit something about the morphology also had me looking for pacing spikes initially – but I couldnt see any further evidence to support. If this was a paced rhythm , they way I read it, you would have to assume from the rate and morphology that it was dual chamber and trying to track at or around the URL, possibly going into Pacemaker Wenckebach and pacing from the left ventricle only, ie not Biventricular synchrony .
Is that a thing?
I cant keep up with all the different pacing synchronisation modes!
As no discernible P waves – Underlying rhythm seen as Atrial Flutter with 2:1 and variable block, RBBB, left axis and possible RVH pattern noted (v1).
Amanda Quigley
Allan Enoc (SWB)
Thanks, Amanda. Not sure about RVH, especially as there’s a left axis deviation. Could the appearance in V1 just be due to the RBBB? I’ll give it some more thought.
Atrial Flutter with variable block, RBBB
Thanks William. You may well be correct, but is there anything else that should be mentioned?
Amended Details: A review of the full Hx/Ix context above and a more detailed examination of the ECG suggest a possible alternative interpretation for this case.
Atypical Flutter at about 240bpm with variable , 2:1 , 3:1 conduction, RBBB with secondary repolarisation abnormalities consistent with the RBBB and voltage (V1/V6) criteria indicating RVH. Q waves in II, III and aVF and V4-V6 consitent with INF MI & ANT MI of indeterminate age. Its hard to diagnose RVH in the absence of RAD but in this case concurrent INF MI wall loss and likely LVH (based on echo as the ECG doesnt meet LVH criteria) could explain the LAD. As LAFB is normally a diagnosis of exclusion, it is diffcult to keep it on the list in the face of other causes of LAD.
Thanks, Jeff. You’ve provided some thoughtful analysis that highlights some of the difficulties and complexities in interpreting this ECG.
There is an underlying atrial rhythm at ≈231 bpm (this could be Atrial tachycardia or Atrial flutter) with right bundle branch block, left axis deviation due to old inferior-lateral myocardial infarction (given pathological Q waves) and T wave abnormalities in the high lateral leads.
The conduction ratios imply dual level AV block – 2:1 at the upper level and varying cycles of Wenckebach at the lower level (the strip mostly shows 3:2 and 3:4, while the 12 lead shows longer cycles).
The P waves in lead II appear very wide, likely due to very large atria/delay in atrial conduction (related to the cardiac history mentioned above), this could explain a slower atria rate than is typical in most flutters. That being said, I am finding it difficult to see evidence of continuous atrial activation on the 12 lead ECG, however it may be obscured by the QRS-T complexes (?possible down-sloping after T waves). I am uncertain, however I slightly favour AFL over AT.
We await Dave’s comments 🙂
Thanks, Arron – great comments, as usual.
Agree with Arron here.
Looks like AFL/AT with two-level AV block — 2:1 at the upper level and varying Wenckebach cycles at the lower level.
QRS morphology fits RBBB + LAFB, along with the old MI pattern qII, qIII, qaVF, and qV4-6 — the echo findings are therefore unsurprising.
Can I also say that without the benefit of V1, the rhythm would be nearly impossible to decipher. The baseline artefacts don’t help either!
Thanks, Ōkóyè. Can you definitely explain the ventricular irregularity by 2:1 block at the upper AV node and varying Wenckebach at the lower AV node? I can’t make this work but I may be missing something. I certainly agree about the usefulness of V1 here and the problem of the baseline artefacts.