Happy New Year from everyone at SCST! Let’s kick off 2022 with Dr Dave Richley’s ECG of the Month
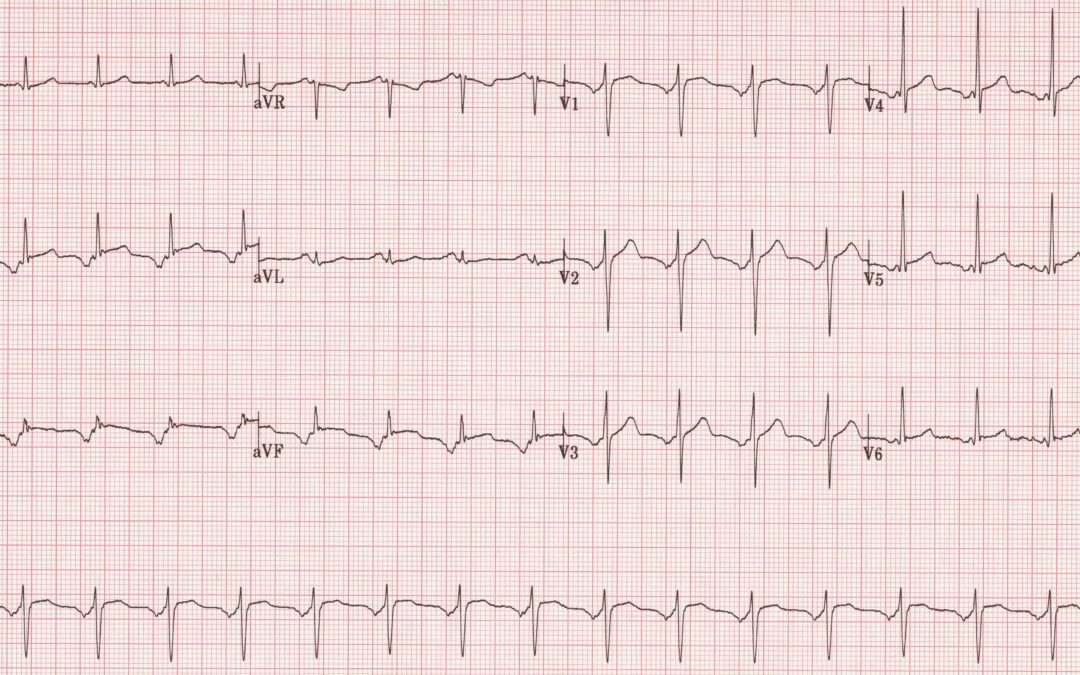
This ECG was recorded from a 38-yearold female who was complaining of a fast heart rate. There was no chest pain or breathlessness and no history of heart disease. There is ST elevation in many leads. Is this evidence of a silent developing myocardial infarction, or pericarditis, or is there some other, more likely, explanation?
The Answer
It’s time to discuss the atrial repolarisation (Ta) wave. The main ECG deflections, obviously, are the P wave, QRS complex and T wave, corresponding to atrial depolarisation, ventricular depolarisation and ventricular repolarisation. The Ta wave is generally ignored and this is because it tends to be very small and of no importance.
The Ta wave is usually opposite in polarity to the P wave and of low amplitude such that in most leads, when it can be seen, it is a shallow, negative deflection, broader than the P wave and immediately after it. Effectively it is buried in the PR segment and QRS complex but can be seen when a P wave is not followed by a QRS complex, as in second-degree or complete AV block.

Figure 1. Isolated P wave with visible Ta wave (ringed in red).
Figure 1 is a short extract from lead II in an ECG that showed second-degree AV block. An atrial repolarisation wave, which drops to 1 mm below the TP baseline, is clearly visible immediately after the blocked P wave. The depth of a Ta wave is proportional to the height of the P wave that precedes it, so when there is a tall P wave, as in the ECG in figure 2, from a patient with right atrial abnormality, the Ta wave is more deeply inverted than normal and therefore more clearly visible.

Figure 2. Tall P wave followed by more deeply inverted Ta wave, causing ST depression (baseline level shown in red).
Here the Tawave manifests as upsloping ST depression of almost 1.5 mm below the baseline, which is shown by a red line. Incidentally, it is thought that the upward-sloping ST depression often seen in sinus tachycardia during an exercise tolerance test may actually be a Ta wave that is deeper than normal because of increased P wave amplitude. This is the reason that the ST segment level is assessed 60 or 80 ms after the J point, when the Tawave has returned to baseline.
So, what is the relevance of all this to this month’s ECG? The P wave in this ECG is inverted in most leads, because the impulse is of a low atrial or junctional origin, and the inversion is deep, giving rise to a prominent Ta wave that, because it is opposite in polarity to the P wave, manifests as ST elevation. This effect is accentuated because of the short PR interval: the adjacency of the negative P wave to the QRS complex, in effect, pushes the positive Ta wave beyond the PR segment and QRS and into the ST segment.
Unfortunately, I don’t have an ECG that was recorded during sinus rhythm from the same patient. This would show pretty conclusively that the ST elevation was due to a large, positive Ta wave.
This unusual cause of ST elevation is often referred to as the Emery phenomenon, reportedly because it was first described by a Dr James Emery in 1978. However, I have been unable to find a reference to confirm this.
Well done to Scott Walton, whose concise explanation of the ECG as ‘Ta!’ can hardly be bettered for brevity, and to Kathryn Taylor who, in her answer of ‘Emery phenomenon’, showed that she too understood the cause of the ST elevation.
Excelerated junctional rhythm?
Thanks, Tracey. Yes, there are negative P waves before the QRS complexes in most of the leads, so the rhythm is of low atrial or AV junctional origin. But what about the ST elevation?
Emery phenomenon
Ta!
A model of succinct explanation, Scott! However, I may have to enlarge on this somewhat in due course.
Early Repolarisation?
Given that they’re relatively young with no chest pain & No reciprocals.
… with AJR
Thanks, Daisy. Benign early repolarisation is certainly something to consider but innthis case the appearances aren’t typical – normally there is a more distinct upward concavity to the ST segments.