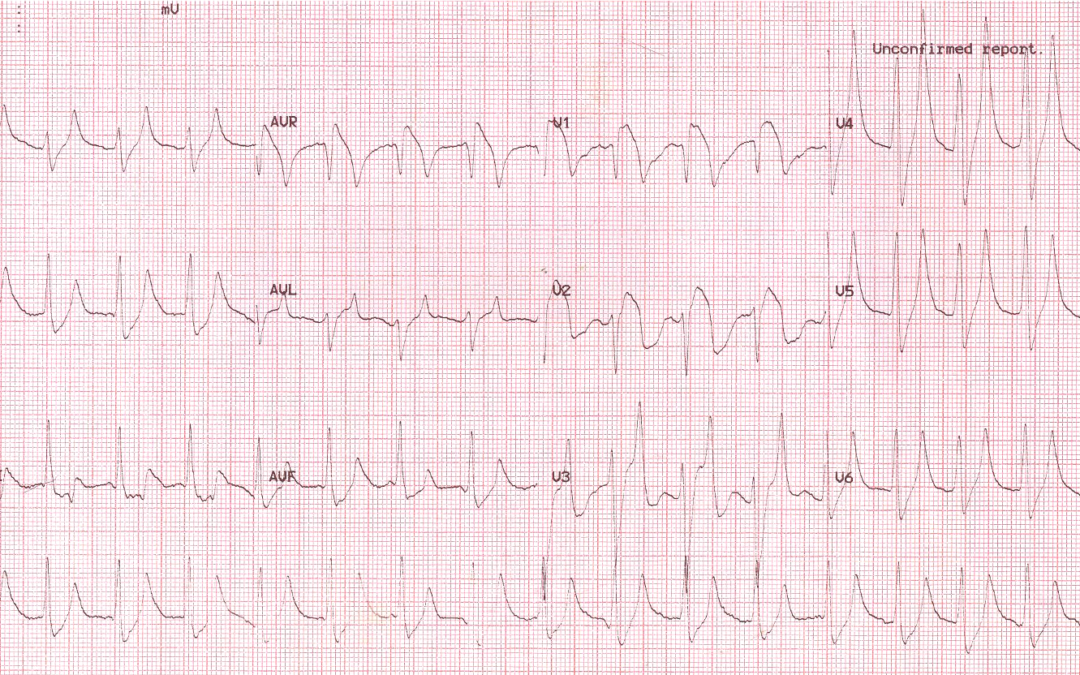
This ECG was recorded from a 28-year old male with known type 1 diabetes. He was admitted to hospital with nausea, breathlessness, extreme tiredness and dull chest pain. What are the abnormal features on the ECG? What diagnosis do they suggest?
Dave Richley
Associate Lecturer
Newcastle University


Hi Dave,
We think this is sinus tachycardia at a rate of 100bpm. Normal QRS axis, QRS duration and PR interval.
Our initial thoughts were Brugada syndrome looking at the saddle-back morphology and inverted t waves in V1-V2. Is there any significant family history? The T waves in V4-V6 are also tall and peaked so we wondered if there was also a electrolyte disturbance in addition?
Beth + Ryan
I can’t quite decide what’s happening with P wave/ PR interval, they look they could be in the Twave, looking at lead III (maybe junctional) with hyperacute tented T Waves. ? Hyperkalemia
Also looks like Type 1 Brugada sign in V1-2
? Induced by the Hyperkalemia.
Collectively caused my diabetic Ketoacidosis.
Hi Dr Richley!
I am a student cardiac physiologist at the moment but thought I would comment and give it a go, apologies if I am completely wrong!l, I know a lot of these ecgs are very challenging!
There are difficult to discern p waves, pointed t waves in most leads mainly v3-v6, st elevation in v1-v3. Approx 100bpm.
I think this patient may have hyperkalemia. The ecg changes support this and the patient has t1dm, Insulin deficiency can be a cause for hyperkalemia supporting this further.
Diabetes leading to hyperkalaemia ?
ECG showing AV dissociation with peaked T waves.
A lot of people on the Facebook group comments have said hyperkalaemia but I think there is more to it than that. My suspicion is diabetic ketoacidosis. I’m struggling to see P waves (I’m on my phone again though!) There may be retrograde P waves in the inferior leads?
It looks like sinus tachycardia at around 100bpm, but the P waves are low amplitude and only clear in lead V3. The PR interval looks normal. The QRS is broad with a bizarre morphology. There appears to be ST elevation in leads V1-V3 and aVr, as well as ST depression in the inferior leads especially III. The T waves are tall and peaked and I think the QTc is long (but might be inaccurate on my phone screen!). The QRS axis looks normal. Overall I think there is evidence of hyperkalaemia but I’m not totally sure if there’s something else like ischaemia going on as well. I would be really interested to see the ECG after treatment.
Thanks for your comments, Leah. I’ll wait a bit to see if anyone else has anything to say about the ECG before I chip in.
Quick diagnosis. Septal MI secondary to Insulin toxicity.
Appearance of Sinus Tachycardia with a rate of 100bpm. P waves are visible in lead III but are low amplitude.
The peaked T waves are indicative of Hyperkalaemia.
Widespread ST depression with the majority upsloping.
ST elevation evident in V1-V2.
It would be easy to overlook the presenting symptoms, the patient is diabetic, type 1 and insulin dependant.
This patient may be having a septal MI secondary to insulin toxicity.
Thanks, everyone, for your interesting comments – I won’t reply to you all individually at this point. I’ll wait a bit longer before I summarise the case.
Thanks to everyone for their suggestions. As many have worked out, this is a case of hyperkalaemia secondary to diabetic ketoacidosis. The three textbook ECG features of hyperkalaemia are:
• Tall, tented T waves
• Broadening of the QRS
• Small or absent P waves
As serum potassium rises the first change in the ECG is usually the development of tall T waves. The T waves are not only tall, they have a distinctive shape, being pointed, symmetrical and ‘tented’, which distinguishes them from the tall, more rounded T waves of hyperacute myocardial infarction and from normal variant tall T waves, which tend to be asymmetrical with a steeper downstroke than upstroke.
After an increase in the height and shape of the T waves, the QRS starts to broaden but in a general way that doesn’t suggest bundle branch block, and this broadening continues as the serum potassium rises.
The final of the 3 classic hyperkalaemic ECG signs is the loss of amplitude and possible disappearance of the P waves. Normally this is seen only in severe hyperkalaemia.
In this ECG we see all three of these signs. The T waves have amplitudes of up to 3 mV (in V4); the QRS duration is difficult to measure precisely but appears to be at least 120 ms; and the P waves are either small or absent.
But hyperkalaemia is not always associated only with the three ECG features just described. Sometimes there is tachycardia, but in other instances the heart rate is abnormally slow owing to sinus bradycardia or complete heart block. Sometimes, as here, there is downsloping ST elevation in V1 and V2 that may mimic the changes of Brugada syndrome or acute myocardial infarction.
In this case, the serum potassium level was 8.9 mEq/l, which equates to severe hyperkalaemia. However, because of the patient’s chest pain and ST elevation, and because he also had an elevated troponin level, he was taken to the cath lab for coronary angiography, and this revealed clean coronary arteries.
In summary, this is case of severe hyperkalaemia due to diabetic ketoacidosis.
Thank you, nice to know I can still do it after all these years