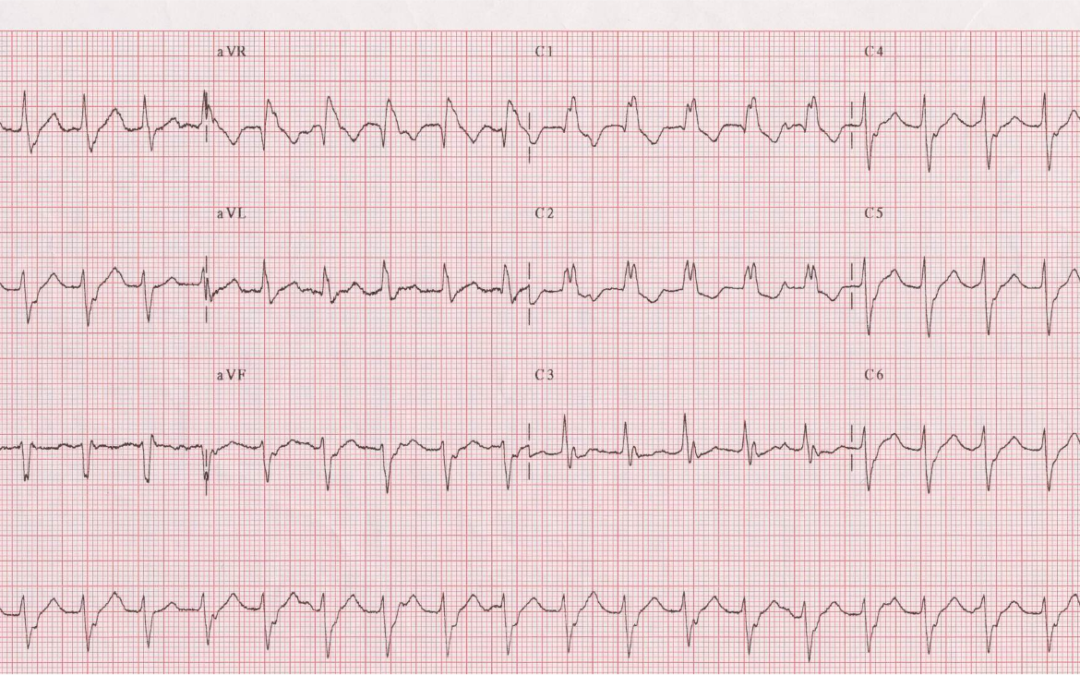
This month’s ECG was recorded from a 28-year old male while he was suffering from palpitations. He had no history of heart disease. After the administration of intravenous verapamil his heart rate suddenly normalised and a repeat ECG (not shown) revealed sinus rhythm with no abnormalities. What was the presenting arrhythmia?
Answer:

Thanks to everyone who has commented on the ECG – there have been some astute observations. Let’s have a close look at what’s going on. There is a regular, broad-QRS tachycardia at a rate of 125 bpm. What is the rhythm? It’s been said so often that it has become a cliché, but it remains true that a regular, broad-QRS tachycardia is VT unless it can be proved otherwise. So, is this VT, or can we prove that it is something else? It may be said that this just doesn’t look like VT – it’s not bizarre enough – but that would be to ignore the fact that VT takes many different forms.
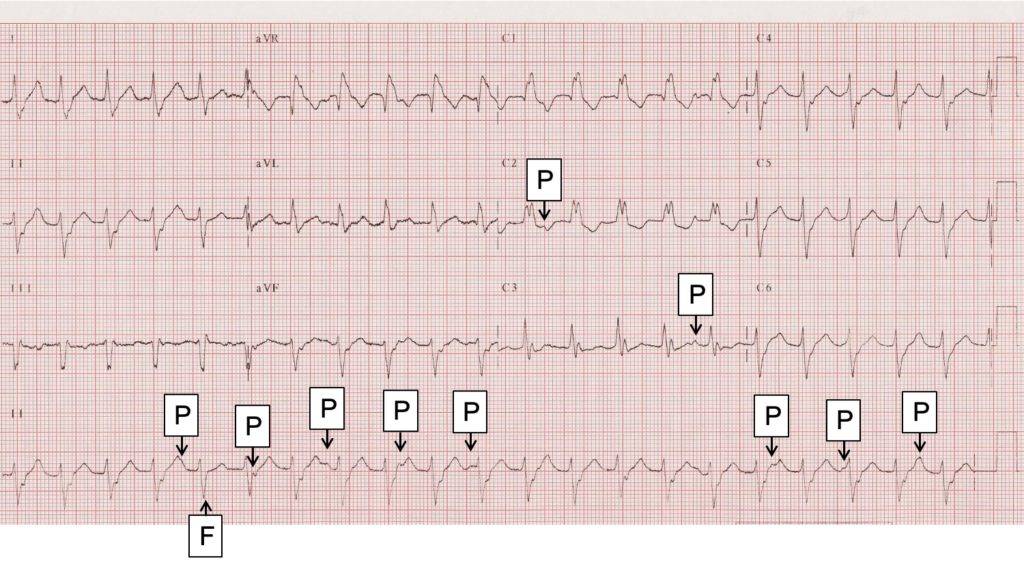
In elucidating any arrhythmia it is generally useful to identify the atrial activity if there is any. In this case, if we study the ECG very closely we can see regular P waves at a rate of about 83/minute, and I have marked these with a ‘P’. Some of these P waves are clearly visible; others are partially masked by a QRS or T wave and therefore more difficult to make out. Sometimes they can be seen more clearly in one lead than in others, but generally they are pretty clear in the lead II rhythm strip. Undoubtedly there are additional P waves that occur exactly simultaneously with a QRS and therefore cannot be seen at all. These regular P waves, occurring independently of the QRS complexes, are evidence of an underlying sinus rhythm and therefore of AV dissociation. Although we don’t need to prove that this is VT – the burden of proof falls only on those who believe it not VT – the presence of AV dissociation demonstrates beyond any doubt that we are looking at VT. It is of note that the 5th QRS (identified with an ‘F’) is slightly narrower than the rest. This beat, occurring just after a P wave, is a fusion beat – partly conducted and partly of ventricular origin – and an easily identifiable sign of AV dissociation even if the P waves had not been clearly discernible.
Some in the past have interpreted this ECG as showing SVT with right bundle branch block/left anterior fascicular block aberrancy. However, if we study V1 we can see that the QRS does not show a typical RBBB pattern. There is an initial small Q wave, followed by broad notched R wave, rather than the rSR’ morphology that would be expected with RBBB. Moreover, the AV dissociation completely excludes the possibility that this is SVT.
As has been pointed out, this is probably a fascicular VT. The atypical RBBB morphology and left axis deviation are characteristic of a tachycardia that originates in (or exits from) the posterior fascicle of the left bundle branch. Fascicular VT is often idiopathic, meaning that it is not due to structural heart disease, metabolic/electrolyte disturbances or a channelopathy. Idiopathic VTs, of which there are several varieties, rarely cause death and generally carry an excellent prognosis. However, they may cause troublesome palpitations and if so they can often be cured by catheter ablation. Unlike VTs caused by structural heart disease, the idiopathic forms are aften sensitive to verapamil.
Dave Richley
Associate Lecturer
Newcastle University


Bit difficult on a small screen without being able to zoom in but my initial thoughts were atypical AVNRT with RBBB however now I’m considering a fascicular VT instead
Right bundle branch block.
Thanks Cashman. So, what do you think the actual rhythm is – sinus tachycardia, some sort of SVT, VT, or something else?
Without doing any research, at first it looks like RBBB with LAFB, then I see possibly dissociated P waves buried in the previous ST/T area, so I wonder about some sort of specific junctional/idioventricular tachycardia, I don’t think it’s RVOT VT
Thanks for your observations and reasoning, Jamie. I’ll respond in due course.
Regular rhythm at a rate of approx. 135bpm. No clear sinus P wave before every QRS complex. Can see some atrial activity but doesn’t appear to be related to the QRS complex. The QRS complex is wide but not overly wide approx. 120ms with a RBBB morphology. There is also abnormal left axis deviation. Differential for regular wide complex tachycardias are VT, SVT with aberrancy and antidromic AVRT. The history and the drug choice are good clues and I could be wrong but think I already know the answer to this one. Will hold off for now.
Thanks for the comments, Max. I also suspect you know the answer, so thanks for the restraint!
I think it’s fascicular VT arising from the left posterior fascicle. Rate is approx 135, with a RBBB morphology and left axis deviation. Beat 5 is possibly a fusion beat with a slightly different morphology compared to the other beats and lead II shows independent atrial activity. The fact it is sensitive to verspamil supports it being fascicular VT.
Thanks very much for your comments, Leah. I won’t say anything about the ECG just yet – I’ll wait to see if anyone else has any opinions first.
I agree with what Leah has said (except I make the rate closer to 125bpm) especially now I’ve managed to look on a bigger screen than my phone! My initial thought was atypical AVNRT with RBBB but looking more closely there are the signs which Leah mentioned which make it much more likely to be a fascicular VT
Thanks Katie. I think we may be starting to see a consensus emerge. Are there any dissenters out there?