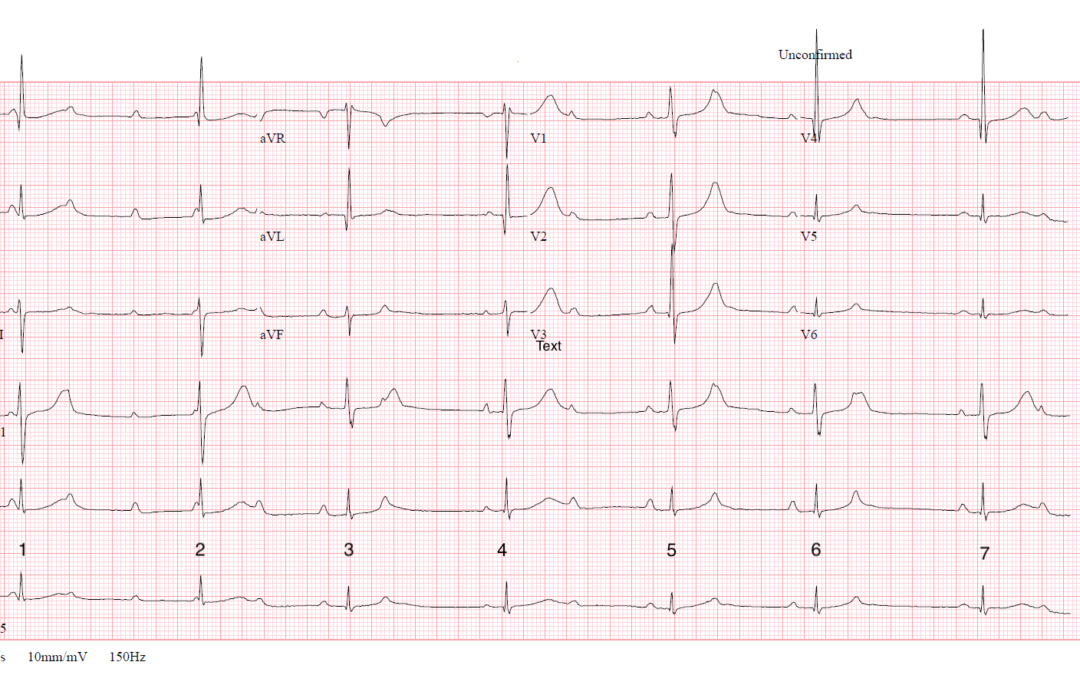
I don’t have any clinical details but this month’s ECG is an exercise in rhythm analysis. What exactly do you think is going on here? I’ve numbered the QRS complexes to facilitate discussion.
The Answer
It might be tempting after glancing at this one to say that it shows complete heart block with a junctional escape rhythm, but a couple of features should prevent us from jumping to this conclusion. First, the ventricular rate is not completely regular and, second, there are two distinct QRS morphologies. Let us have a close look at the ECG. I’ve identified and numbered all the P waves, then I have numbered the QRS complexes and finally, I have constructed a laddergram to show what I think is happening.
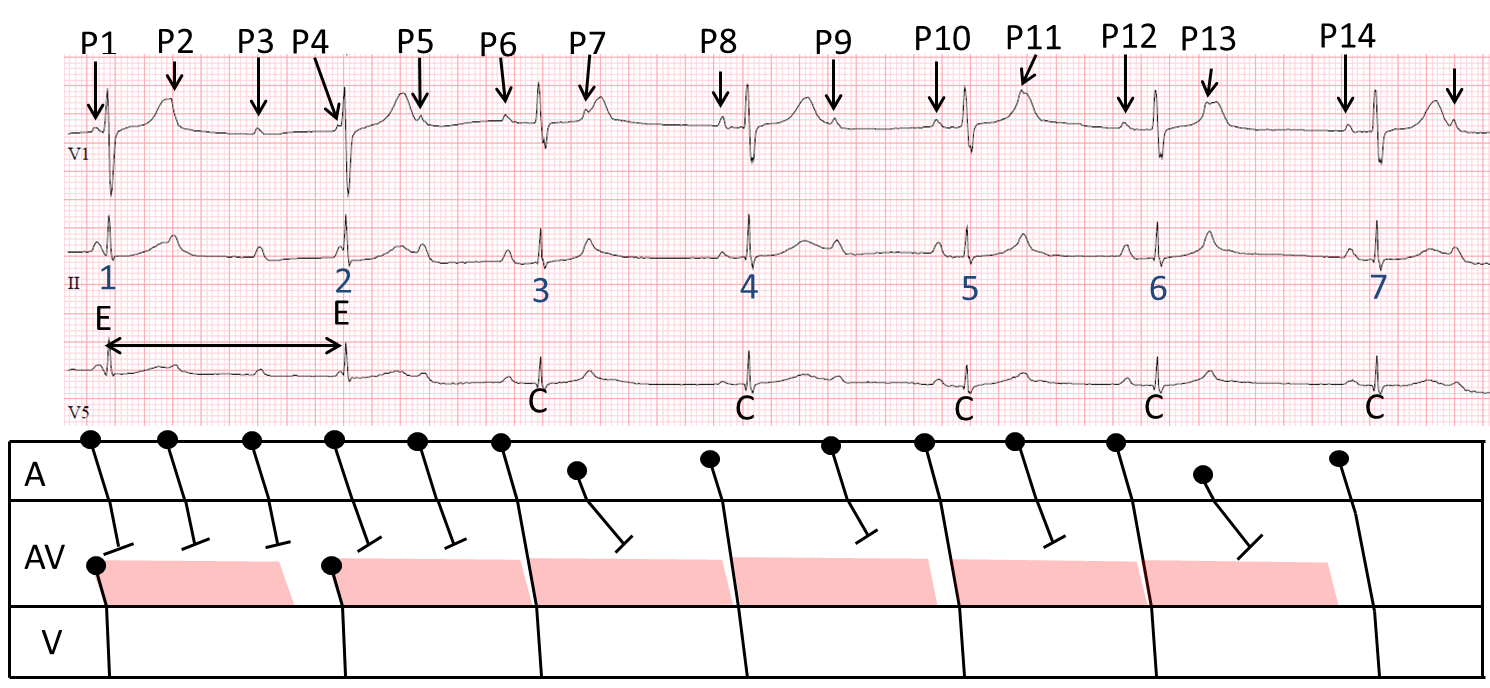
We will sort out the atrial rhythm first. The P waves are generally pretty regular with a rate just above 100/min, slowing down slightly to just under 100/min. However, there are two P waves – P7 and P13 – which are premature, and which therefore probably represent atrial premature beats (APBs). There are also two P waves – P8 and P14 – which end the post-APB pauses and which are of slightly different morphology to the sinus P waves. I think these must represent atrial escape beats. Now for the QRS complexes. The first 2 complexes are of a slightly different shape from the rest and are separated by a long RR interval of 1.66 s. These two complexes bear no relation to the P waves, so must be junctional escape beats and they arise because none of the first 4 P waves conduct. After this, though, every other P wave is followed by a QRS, and complexes 3, 5 and 6 have a very similar PR interval, so I think these must be conducted sinus beats. The atrial escape beats – complexes 4 and 7 – also conduct but with a slightly different PR interval. The APBs (P7 and P13) are not conducted.
So, why is it that none of the first five P waves are conducted, whereas after that every other P wave is conducted? I think it’s all down to the slight drop in atrial rate. To illustrate the effect this has on atrioventricular conduction I have shown what I believe the refractory period of the lower AV node might be by a pink parallelogram on the laddergram. If any atrial impulse arrives at the lower AV node during the refractory period it cannot conduct. The laddergram shows why the first five sinus impulses are not able to conduct to the ventricles: they all arrive at the lower AV node while it is till refractory and they cannot proceed any further. P6, however, conducts down to the lower AV node just after the refractory period has ended and therefore continues to the ventricles. P7 is the first APB and it cannot conduct to the ventricles, but the atrial escape, P8, can. After this there is a short run of 2:1 block, when, because the atrial rate has slowed, every other sinus impulse arrives at the lower AV node after the refractory period has ended and proceeds to the ventricles.
So, how can we best summarise the AV block we see here? Sometimes AV block is a little too complex to fit easily into the standard, simple classification scheme. At the start of the ECG, high- grade AV block is probably a fair description of what we see, after which there is 2:1 block. The reason the degree of block changes is instructive. It is not that anything about the conduction system itself changes, that the conduction somehow deteriorates: it is simply that the atrial rate slows slightly, allowing alternate impulses to reach the ventricles. This apparently paradoxical situation, in which the ventricular rate speeds up as the atrial rate slows down, is well known. AV block is not always a fixed entity: it can be dynamic and vary with the atrial rate.
Thanks to those few brave souls who participated in the discussion – I agree with most of what was said.
If you disagree with any of this, or have anything to add, please post your comments.
Dr. Dave Richley
Initial thoughts are 3rd degree AV block with a junctional escape rhythm as the perfusing rhythm.
The atrial rate is regular and approximately 100 bpm and the ventricle rate is about 42 bpm although the RR interval is slightly irregular.
The QRS is narrow and I’ve calculated the QTc at ~371 based on the average of the QTc following both the longest and shortest RR interval.
There is R wave progression till V4, where there is a qRs pattern for ventricular depolarisation.
There seems to be some degree of alternating height in the QRS .
I hope I’m on the right track and always look forward to seeing the answer!
Thanks very much for opening the discussion, M. I guess my only question (at this point!) would be: if this is a junctional escape rhythm, why is it irregular?
Seeing the other comments has me thinking I’m not quite there, especially given the irregular ventricular rate!
I feel that the baseline rhythm is for this patient is actually 2:1 AV block – the beginning of this ECG is a higher grade block during an accelerated ectopic atrial rhythm, with likely junctional escape beats (1 and 2), with conduction of the penultimate P-wave from this focus (QRS complex 3).
QRS 4 is preceded by a sinus P-wave, and marks the return to 2:1 AV conduction, however QRS complexes 5 and 6 are followed by non-conducted atrial extrasystoles, rather than sinus P-waves – then a return to probable 2:1 from QRS complex 7.
As ever with these snapshots of rhythm, a longer rhythm strip would be extremely useful.
Thanks for your, as always, detailed and considered comments, Scott. To be honest, I think you’ve looked at this more closely than I have so I will study the ECG in detail and post my analysis eventually – not just yet, as I’m very interested in hearing others’ views first.
Every opportunity to read Dr. David Richley’s comments is an opportunity to learn something new. It seems that there is underlying sinus arrhythmia. I think QRS 3 – 7 are all sinus captured beats. And QRS 1-2 perhaps is juctional escape beat depending on what the rhytm was before, because these could also be sinus captured with abberancy due to concealed ectopy or local refractoriness.
Add to previous comment. There is AV-block. The varying PR prolongation favours block in the AV-node. But i am not sure if this should be classified as paraoxysmal AV-block or high grade AV-block.
Thanks very much for your comments, Enis – it’s good to see you here!
Great explanation with a very useful laddergram.
The only other question I have is that do you not think P11 is also an atrial ectopic?
The interval from P10-P11 is shorter than P8-P9 for example.
Not that it changes the rest of the interpretation though
That’s a very fair question, Jon. When the P wave is on top of a T wave, as P11 is, it’s difficult to be sure of the exact timing and morphology. However, I think the P10-P11 interval appears to be about 600 ms, which is pretty typical of, most of the sinus PP intervals. Admittedly the P11-P12 interval appears to be about 720 ms but this may represent ventriculophasic sinus arrhythmia or just a slowing of the sinus node discharge rate, because the last PP interval on the strip is similar. You make the comparison between P10-P11 and P8-P9, but P8 is an atrial escape beat, which will re-set the sinus node and therefore delay the next sinus beat. So, I think that P11 is probably a sinus P wave, but I’m not absolutely certain.