
Two for the price of one this month. I am grateful to Arron Pearce, cardiac nurse and ECG analyst for ECG 1, which was recorded from a 76-year-old hypertensive male. ECG 2 was recorded from a 74-year-old female.
Both ECGs show an irregular rhythm but how would you describe the rhythm in each case? Are there any significant differences between the two or are they essentially the same? I’m not absolutely certain of the answers so I would be interested to see what people think.
Dr Dave Richley
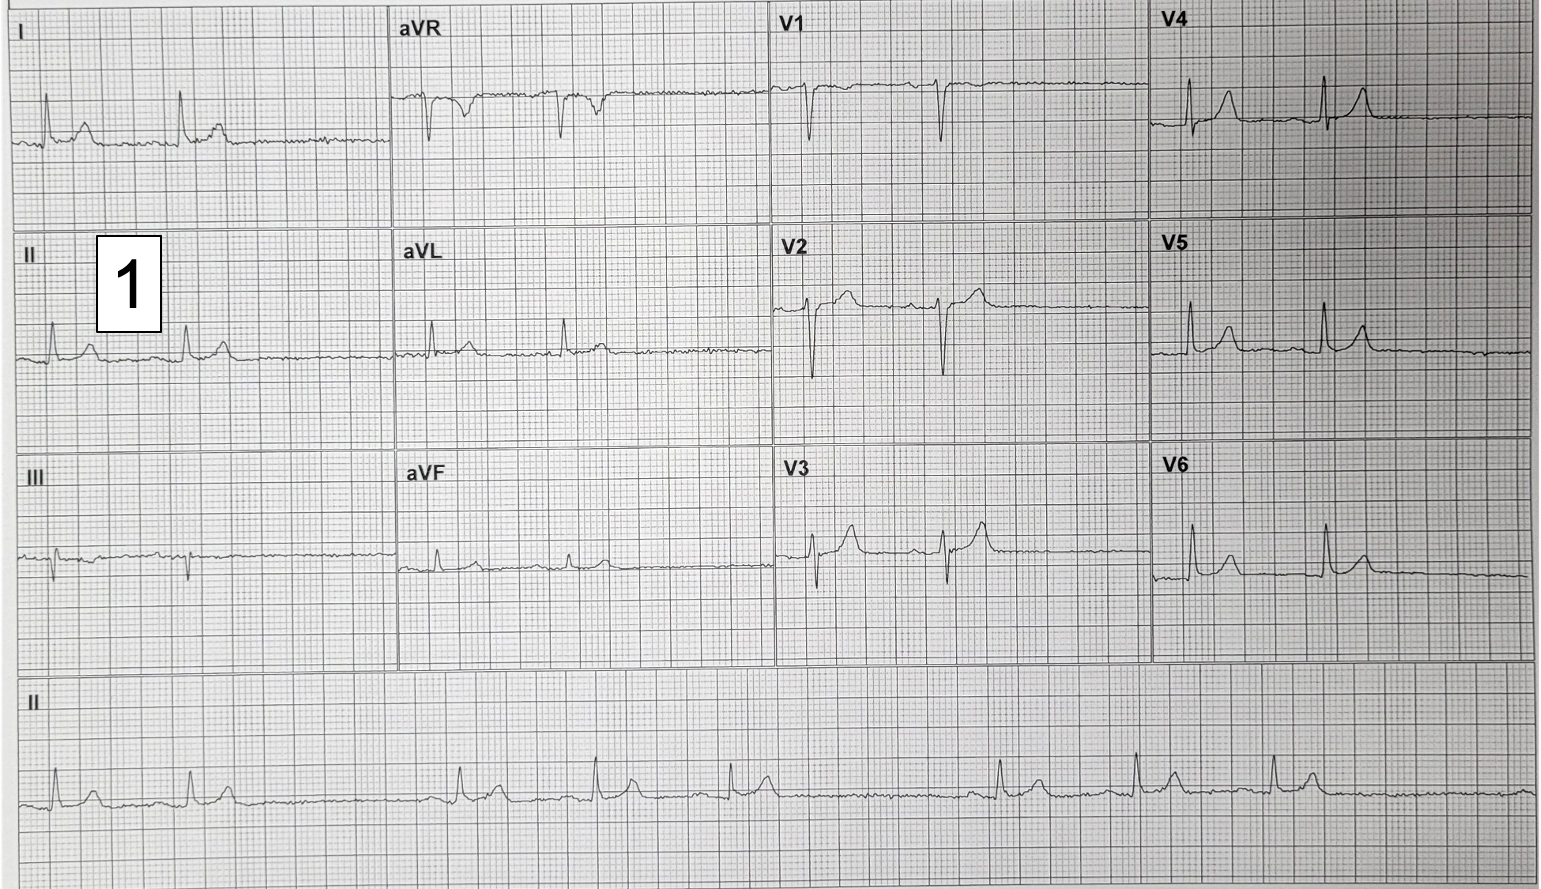
ECG 1
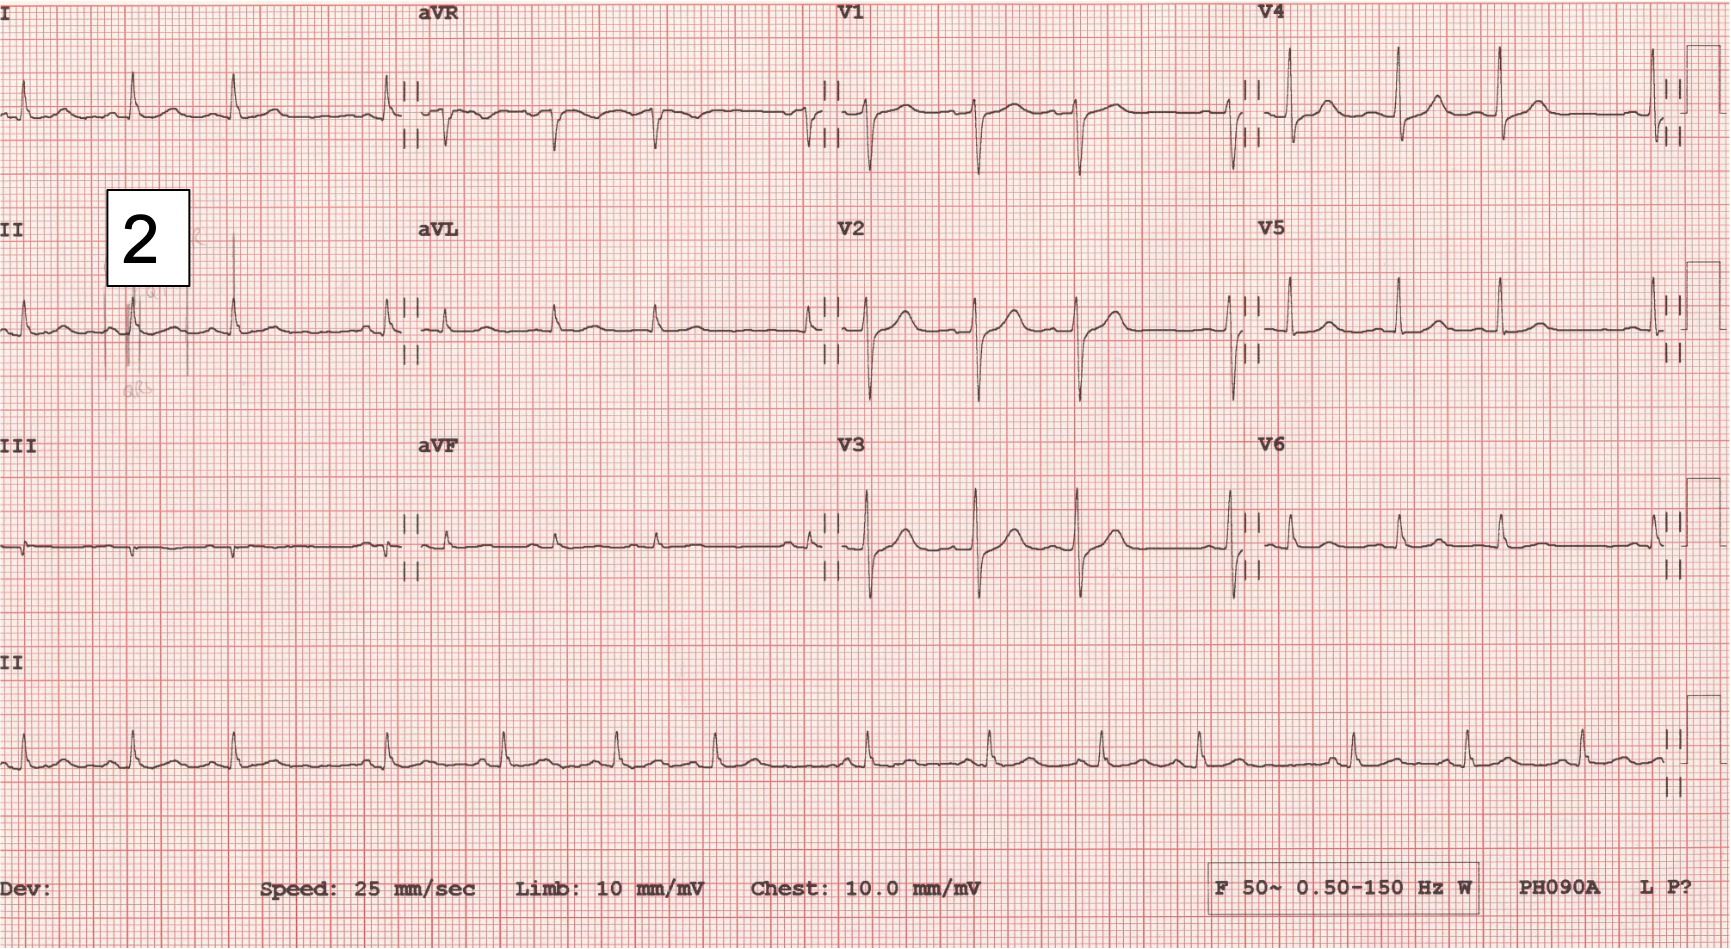
ECG 2
Answer Added 25.06.24
The two ECGs have something in common: in each case the atrial rate is irregular, and there is therefore an irregular ventricular rate. Why is the atrial rate irregular? In each ECG all the P waves are of the same shape and there are no blocked atrial impulses, but there are ‘pauses’. These pauses could be as a result of sinus arrhythmia or ‘sinus pauses’, where the sinus node discharges irregularly, but I suspect that what we are seeing here is sino-atrial (SA) block. In SA block, the sinus node produces regular impulses as normal but some of these impulses fail to exit the sinus node and every time this happens there is a complete absence of P wave, QRS and T wave.
There are two types of SA block: Wenckebach (Mobitz I) and Mobitz II. In Wenckebach SA block the time from sinus node depolarisation to atrial activation increases until a sinus impulse fails to exit the sinus node. The cycle then repeats. In Mobitz II SA block there is a sudden failure of the sinus impulse to exit the sinus node. This is analogous to the situation in second-degree AV block but whereas in AV block we can distinguish the variety by inspecting the PR intervals in consecutive conducted beats before the ‘dropped’ beat, we can only infer the type of SA block by assessing the PP intervals because there is no direct ECG indication of the time from sinus node depolarisation to atrial activation. One of the characteristics of typical Wenckebach AV block is that the RR interval gets shorter with each conducted beat. The analogous situation with Wenckebach SA block is that the PP interval shortens progressively before the pause. Also, In Wenckebach AV block, the RR interval containing the dropped beat – the length of the pause – is always less than double the shortest RR interval. The equivalent finding in Wenckebach SA block is that the longest PP interval is always less than twice the shortest PP interval.
Let’s deal first with ECG 1, which is the simpler of the two tracings. Here, the ‘short’ PP intervals are very similar, differing by no more than 40 ms and the long PP intervals are exactly equal to two short PP intervals (see figure 1). This is entirely consistent with Mobitz II SA block, in which there is intermittent sudden failure of the sinus impulse to exit the sinus node, resulting in the absence of a P/QRS/T.
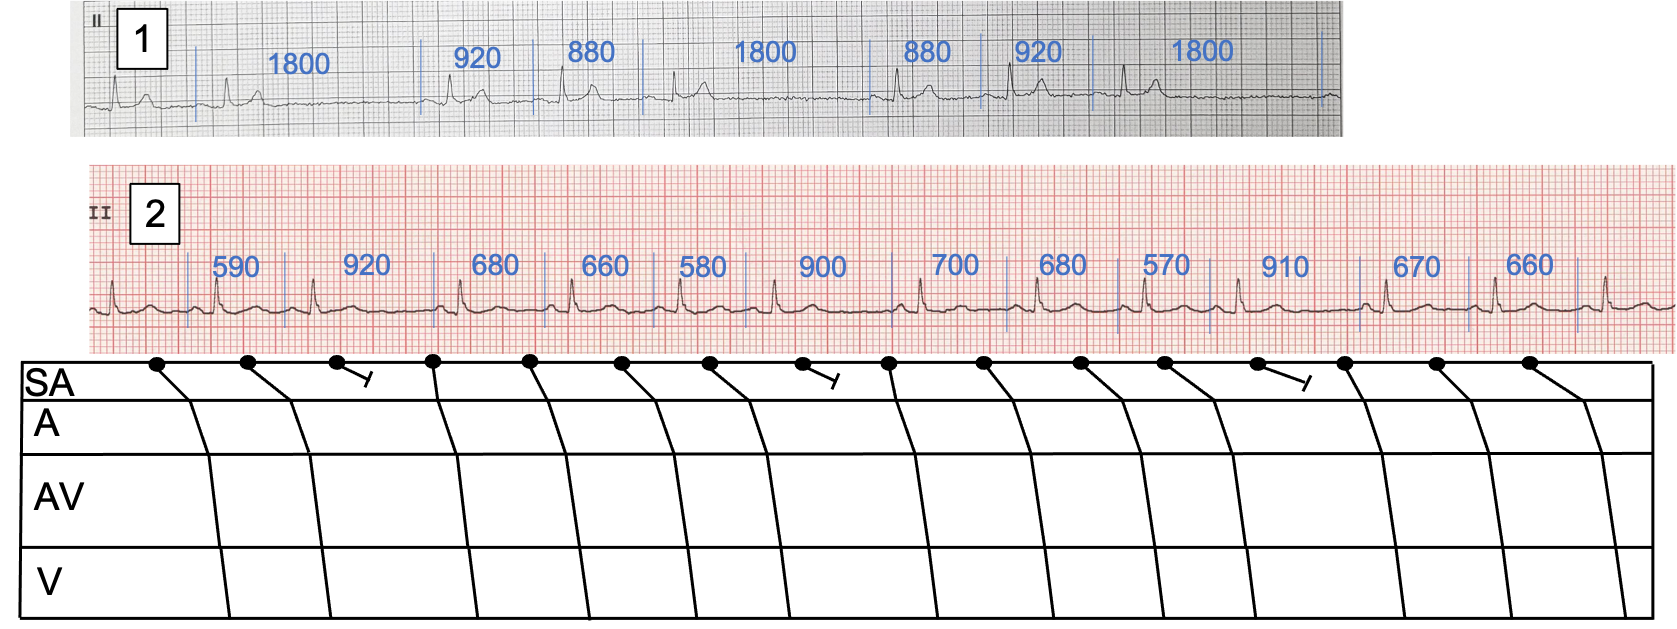
Figure 1: Rhythm strips showing PP intervals in milliseconds for ECGs 1 and 2 and a laddergram for ECG 2.
ECG 2 is more difficult but I think it is very possible that it shows Wenckebach SA block. Each run of beats leading up the pause shows a decreasing PP interval, and the pause is always less than double the shortest PP interval. But, could this simply be sinus arrhythmia? Maybe, but in sinus arrhythmia, there is usually a phasic ‘waxing and waning’ of the PP interval as the sinus node discharge rate speeds up during inspiration and slows down during expiration, and we don’t see that here. Alternatively, as suggested by Arron Pearce, could this be sinus arrhythmia with atrial premature beats? The evidence for this explanation is that there is variation in P wave morphology, as well as atrial rate, suggesting an ectopic origin of some of the impulses. I think that close inspection of the P wave shape in lead II (see figure 2) shows very slight beat-to-beat variation in P wave shape and I wonder if this may be due to slight variation in the exit point of the impulse from the sinus node, with each impulse therefore taking a slightly different route through the atria, rather than occasional atrial premature beats: the sinus node is not a pin-point source but an extensive area of tissue that may be more than 2 cm in length.
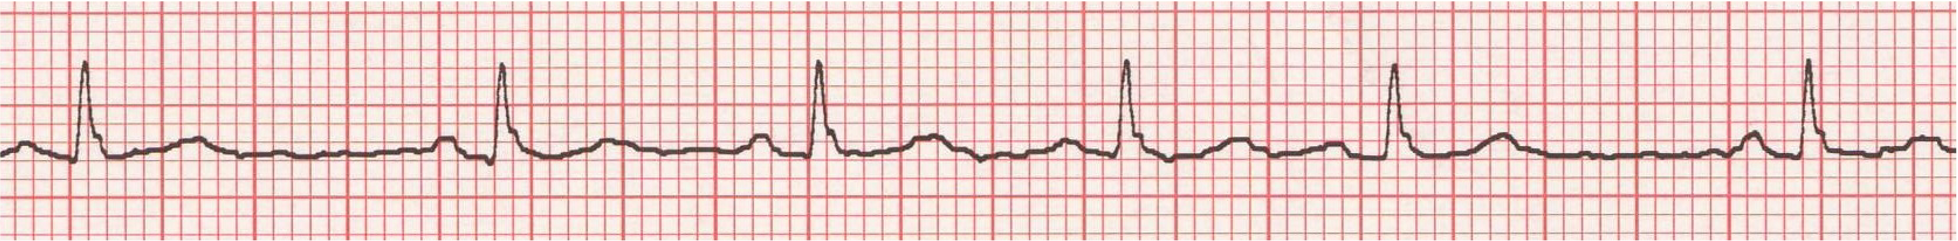
Figure 2: A section of the rhythm strip of ECG 2 showing slight beat-to-beat variation in P wave shape.
The laddergram in figure 2 illustrates how the ECG may be compatible with Wenckebach SA block. I have included a top tier that represents the sinus node, and the laddergram shows the conduction time out of the sinus node increasing until an impulse fails to exit the node, causing the ensuing pause.
So, I think that ECG 2 may show Wenckebach SA block, although I am not 100% sure of this. I am pretty confident that ECG 1 shows Mobitz II SA block. It’s reassuring that Jenny K and Javier seem to share my view.
I have already thanked Arron Pearce for ECG 1. In addition, I wish to thank Harriet Walters, clinical scientist at the Great Western Hospital in Swindon, for the second ECG.
My suggestions, SA exit block on two ECGs:
On 1st ECG- Second Degree SA block Type 2
On 2nd ECG- Second Degree SA block Type1 ( Wenckebach) as the P-P interval progressively shortens prior to the dropped P wave
Totally agreed.
Thanks very much for this, Jenny. I won’t comment yet. I wonder if anyone can offer any alternative explanations.
Alternative explanation for ECG 2 would be Sinus rhythm/sinus arrhythmia with PACs (P wave morphology is subtle different in I, V6 and the first early beat in lead II
Great comment, Arron. I have been wrestling with this dilemma myself. I think I’ve resolved it to my satisfaction and I’ll be submitting my explanation pretty soon.