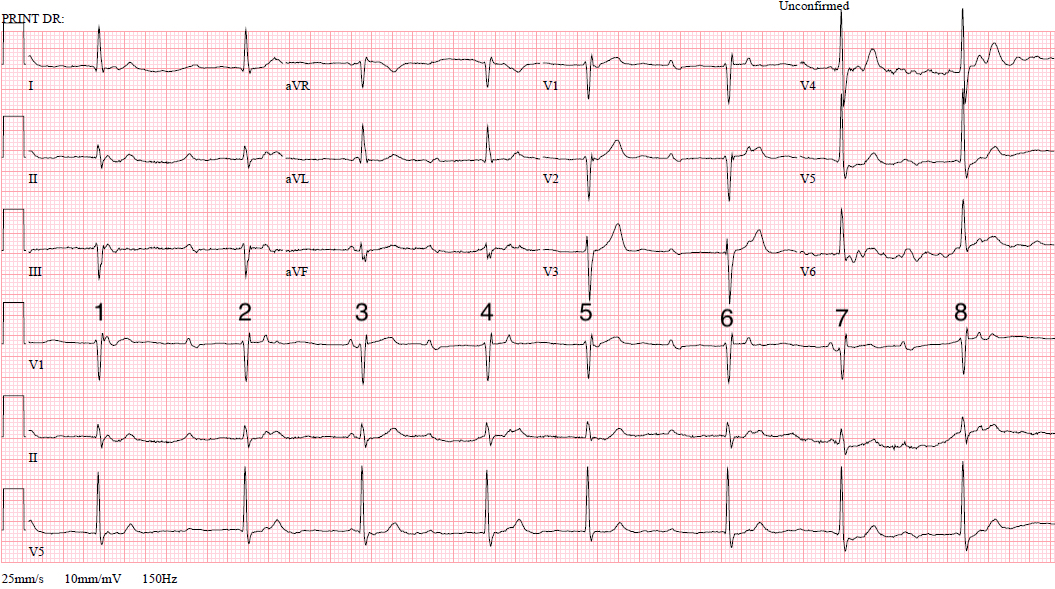
I don’t have clinical information in relation to this month’s ECG but I don’t think it’s absolutely necessary because what I’m interested in is simply a full description of the cardiac rhythm, including any conduction abnormalities. I’m not completely sure of the correct answer, and it may be that there is more than one plausible explanation for what we see, so I’m very interested to find out what you think.
Sorry about the artefact towards the end of the ECG but the V1 rhythm strip is of good quality throughout so analysis should not be hindered.
The Answer
To help me explain what I think is happening here I have drawn a laddergram on which I have labelled all the QRS complexes R1 to R8 and all the P waves P1 to P12. One of these P waves – P7 – cannot be seen clearly but I think its presence and position can be inferred from the attenuated S wave in R5 in lead II. I have also measured in milliseconds all the PR intervals and shown them in red, and all the PP intervals, which are shown in green.
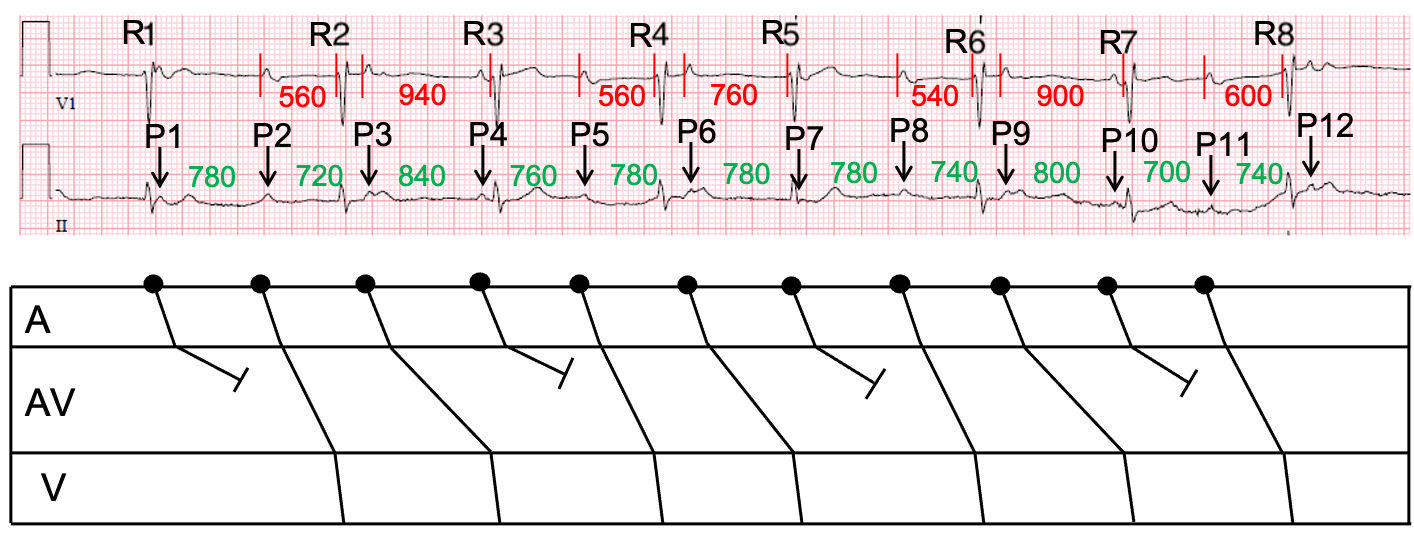
At first sight it may appear that there is no relation between P waves and QRS complexes and, because the ventricular rate is slow, it may be tempting to diagnose complete heart block. However, the ventricular rate is obviously irregular, and this almost rules out complete heart block with an escape rhythm.
Instead, I think there is Wenckebach AV block with some very long PR intervals, so long in fact that it is difficult to see the relationship between the P waves and the QRS complexes. One of the features of this ECG which makes the Wenckebach block particularly difficult to see is that two of the P waves – P4 and P10 – appear shortly before QRS complexes (R3 and R7) but both of these atrial impulses are blocked, not conducted, and it is the previous P waves – P3 and P9 – that represent conducted impulses. This is difficult to appreciate because when a P wave occurs just before a QRS we automatically tend to link the two events in our minds and assume that there is conduction. It is much more difficult to link a P wave to a QRS when they are widely separated with a very long PR interval, as here. The longest conducted PR interval on this ECG is 940 ms, which some may regard as unfeasibly long, but PR intervals of over one second have been reported.
You may wonder why, if this explanation is correct, there is some variation between equivalent PR intervals in the three different complete Wenckebach sequences. I think this is due to slight variation in the atrial rate. Generally, in Wenckebach block, the earlier a P wave occurs in relation to the preceding QRS, the longer is likely to be the PR interval. This is because relatively early atrial impulses are likely to find the AV node in a less advanced state of recovery, causing them to conduct more slowly. To illustrate how this principle works, let’s compare the first 2 Wenckebach sequences. Each one begins with a PR interval (P2-R2 and P5-R4) of 560 ms. But the 2nd PR interval (P3-R3) of the first sequence is 940 ms, whereas the 2nd PR interval (P6-R5) of the 2nd sequence is only 760 ms. Why the difference? Well, the 1st PP interval (P2-P3) of the 1st sequence, at 720 ms, is less than the 1st PP interval (P5-P6) of the 2nd sequence, at 780 ms. This means that P3 occurs at a slightly shorter interval after the preceding QRS than does P6, with the consequence that AV nodal conduction is slower for P3 than for P6. This phenomenon is known as RP-PR reciprocity.
In summary, this ECG appears to show sinus rhythm with 3:2 Wenckebach AV block and some long PR intervals. Well done to all who got this right, and particularly to Scott Walton, who worked it all out very quickly.
If you think I’ve got it wrong, and especially if you have an alternative explanation, please post your opinion. The discussion doesn’t have to end with my ‘answer’.
I am very grateful to Maxine Guillen for sharing this ECG with me.
second-degree atrioventricular block , type I ,Prompt atrioventricular nodal dual pathway
Thank you for your comments, wck. Could you possibly provide a bit more detail of exactly what you think is going on? It would certainly be very helpful to know what you mean by prompt AV nodal dual pathways and the part they play in this arrhythmia. Thanks!
I like to call this “Super-Wenckebach”; I’m not sure why this terminology hasn’t caught on amongst my colleagues over the years.
The red herrings here are the short PR intervals (3 and 7), which I believe are actually the blocked P-wave of the Wenckebach sequence (their corresponding P-waves in 1 and 5 being merged/engulfed within the QRS complex), giving us therefore a 3:2 conduction ratio with extremely long PR intervals.
I didn’t understand what was going on here until I read your comment (as often happens). To me at first glance the QRS complexes looked fairly regular with 5 (and probably 1) being premature.
I was trying to understand what you meant by “Super-Wenckebach” and ended up drawing out a (very crude looking) laddergram to try to link the P waves and QRS complexes in a Wenckebach pattern and was amazed that it actually made a lot of sense!
It still feels a little weird that such a high degree of Mobitz I can exist without it simply becoming Mobitz II, but it’s quite cool to see!
Interesting comments from Scott and Jon. So, do you agree that this is Wenckebach block, or do you disagree? If you think it’s something else, then what? Please post your opinions! I’ve got my own views but I’ll keep them to myself for now.
Judging by the other comments, I may be way off the mark – but from how I look at the ECG, it looks as if the patient has complete AV block, though the rate isn’t very bradycardic. I mainly thought his because the P-P intervals are regular and the lack or association between the P-wave and the QRS complex.
Thanks very much for joining in the discussion, Olivia. One of the criteria for diagnosing CHB is a slow, regular ventricular rate. The ventricular rate here certainly is slow, but is it regular? You have pointed out that the P waves are regular, but in fact this isn’t a requirement of CHB. CHB requires only that no atrial impulses can conduct to the ventricles. I’m preparing my explanation (which of course may be wrong!) and I’ll post it within the next few days. In the meantime, does anyone else have an opinion on this ECG?
This is a great example of the difference between physiological and pathophysiological Wenckebach. In days gone by we didn’t consider WKB a good indication for cardiac pacing, but this really does depend on context; it doesn’t always indicate conduction tissue disease, but sometimes it genuinely does – mostly in older patients of course.
Physiologic WKB occurs as a result of parasympathetic tone slowing conduction in a functionally normal AV node. Exercise testing can be utilised to assess this, as block resulting from genuine conduction tissue disease is likely to worsen with increasing heart rate, rather than improving (Advanced Concepts in Arrhythmias: HJL Marriott, 1998).
This example probably exhibits complete anterograde block of the fast AV nodal pathway, with WKB conduction occurring in the intact yet diseased slow pathway. WKB can also occur as a result of Hisian disease, although this is far less common, particularly with a narrow conducted QRS complex.
As usual, a great ECG – thanks Dave.
Great comments, Scott – thanks very much for adding to the discussion.